Spectroscopy: Light and Element Identification
Dr. Walt Volland (Copyright 1997) Due Saturday May 8, 1999
The energy levels in atoms and ions are the key to the production and detection of light. Energy levels or "shells"exist for electrons in atoms and molecules. The colors of dyes and other compounds results from electron jumps between these shells or levels. The colors of fireworks result from jumps of electrons from one shell to another. Observations of light emitted by the elements is also evidence for the existence of shells, subshsells and energy levels. The kinds of light that interact with atoms indicate the energy differences between shells and energy levels in the quantum theory model of the atom. Typically the valence electrons are the ones involved in these jumps.
The "quantum" theory was proposed more than 90 years ago, and has been confirmed by thousands of experiments. Science and education has failed to clearly describe the energy level concept to almost four generations of citizens. This experiment is an exercise aimed at throwing a little more light on the subject. ( Don't laugh too hard at the joke.)
Atoms have two kinds of states; a ground state and an excited state. The ground state is the state in which the electrons in the atom are in their lowest energy levels possible (atoms naturally are in the ground state). This means the electrons have the lowest possible values for "n" the principle quantum number.
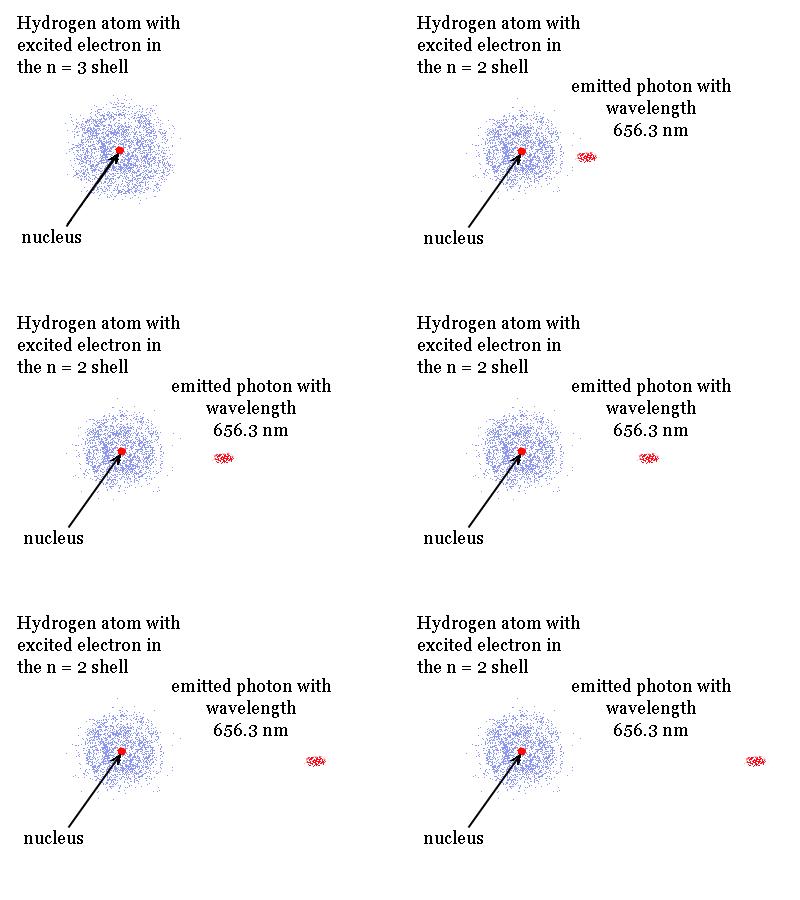
Specific quantized amounts of energy are needed to excite an electron in an atom and produce an excited state. The animation shows the opposite of excitation. It shows how the excited hydrogen atom with an electron in the n = 3 shell can release energy. If the electron only drops to the n = 2 shell the energy matches a pulse of red light.
Note the size of the electron cloud in the excited atom changes when the electron moves from shell to shell.

Energy can be added to atoms many different ways. It can be in the form of light, an electric discharge or heat. This added or extra energy is emitted when the excited electrons in the atoms give off light and fall back to lower shells. The light emitted has wavelengths and colors that depend on the amount of energy originally absorbed by the atoms. Usually each individual excited atom will emit one type of light. Since we have billions and billions of atoms we get billions of excitations and emissions.
Not all atoms in a sample will absorb or be excited exactly the same. For example in hydrogen the ground state has the electron in the n= 1 shell. The electron in some hydrogen atoms may be excited into the n = 2 level. Other hydrogen atoms can have the electron excited into the n = 4 shell.
Different elements emit different emission spectra when they are excited because each type of element has a unique energy shell or energy level system. Each element has a different set of emission colors because they have different energy level spacings. We will see the emission spectra or pattern of wavelengths (atomic spectra) emitted by six different elements in this lab. We will then identify an unknown element by comparing the color of the unknown with the flame color of our knowns.
You need to know that white light is the combination of all colors of the spectrum.

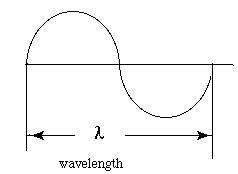
Each color has a characteristic wavelength. The wavelength is the distance between the beginning and end of a complete cycle of the light wave. All colors of light travel at the same speed, 3.0 x 10⁸ meters/ second.

Arizona State University has a nice page on Light at this URL.
http://acept.la.asu.edu/PiN/rdg/readings.shtml
Colorado State University physics department has an animation of the H atom at this URL
http://www.colorado.edu/physics/2000/quantumzone/lines2.html
Definitions of terms and properties of light are at this site
The speed of light frequency and wavelength are related by the formula
where c is the speed of light 3.00 x 10⁸ meters/ second.
n is the frequency of the light wave in cycles per second
Lambda, l is the wavelength in meters / cycle. This measures the number of cycles of a wave that pass an observer in a second.
These individual cycles each carry a specific small amount of energy. The particles of light are called photons. The energy of a light photon or particle is different for each color. If you have ever seen a Star Trek movie you may have heard of "photon torpedoes" . The science fiction writers suggest that bundles of light energy could be harnessed and used as projectiles.
We can calculate the energy of a photon or wave packet using the Planck energy relation shown here. Planck won a Nobel Prize for this work.
- here E is the energy of the photon in joules
- h is Planck's constant 6.624 x 10⁻³⁴ joules seconds
- n is the frequency of the particular light wave
Red light has longer wavelength and is lower in energy than blue light.
The wavelength of red light corresponds to the range of 700 to 600 nanometers, (7000 Ångstrom or 0.0000007 meters).
Blue light has shorter wavelength in the range of 400 nm (4000 Ångstrom or 0.00000004 m, 1 Å = 1 x 10 -10 m = 1 x 10⁻¹ nm).
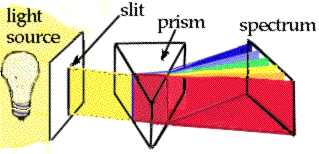
Spectroscopy is the analysis of light spectra and the way in which light interacts with matter. When light is analyzed it is commonly separated into its component colors. The light source is directed on a slit and the "beam" of light is separated using a prism or grating.
The reason that the images are lines is that the light from the lamp is focused on a narrow slit. The illustration shows the separation of a light beam into its component colors.

This produces an image of the slit which has the shape of a line. The resulting beam of light can be broken into the color spectrum. or into its components of the spectrum emitted by the atom. You can see the specific colors emitted by the light source. A white light source will give a spectrum like the one shown above.
The emission spectrum for sodium shows only two colors in the visible color range. The two colors are yellow and have wavelengths of about 590 nm. The continuous spectrum and calibration scale is shown to give approximate wavelength values.
|
-- |
|
|
----------- |
|
A CD-ROM mirrored surface behaves like a grating or prism. If you look at the surface of the CD-ROM under a light, you can see the color spectrum.
Street lights are sodium vapor lamps in many communities. These lamps have an orange yellow tint. You can see from the emission spectrum why the sodium vapor lamps would appear yellow and not white. These lamps consume less energy than the older blue colored mercury vapor lamps. Mercury vapor lamps have been sold in hardware stores for yard lighting.
One of the odd things that we sometimes notice is that colored things have a different appearance in natural daylight than they do under mercury vapor or sodium vapor lamps. This is reasonable because the daylight includes all of the wavelengths of white light and the vapor lights only emit a few specific colors that can be reflected into our eye off of any illuminated article.
Calculations:
Frequency
|
How to calculate frequency, n , from wavelength and the speed of light, c. |
|
|
|
|
|
|
|
|
Energy
The energy of a photon or single pulse of light energy can be calculated using the Planck energy relation
Note: A 100 watt light bulb produces 100 joules every second. This means 3.28 x 10²⁰ photons would have to be emitted every second to transfer the 100 joules in a second. The numbers are tremendously. The atoms and their electrons are constantly changing energy. The electrons are going through ceaseless energy level jumps.
Part 1 Flame tests and identification of an unknown metal.
Observe and record the color of the flame for each metal ion. Remember the metal ions are paired with a nonmetal ion in an ionic formula unit. The electrical charges have to add to zero. The metal ions are excited by the Bunsen burner flame. The nonmetal ions, anions, do not get excited and emit visible light like the metals do.
Repeat procedure for each known. Record the color observed for the unknown and use the color match to identify the metal ion in the unknown.
Part 2 Observing line spectra with the spectroscope
In the second part of the experiment you will observe the color of light emitted by excited gases of elements in sealed glass tubes called "spectrum" tubes. Direct current, DC, high voltage electrons are used to excite the atoms in the spectrum tube. High voltage means 1000 to 2000 volts. This is more than 10 times normal household voltage which is 120 volts AC.
The excited atoms release the energy they gained. Some of this energy is in the form of heat and some is in the form of light. The billions of excited atoms release energy. Each excited atom releases a single pulse of light energy as it returns to the "ground" state or low energy state. There are so many pulses emitted the light appears to be continous.
The excited atoms do not all emit the same energy light because the amount of energy that excited them may differ, but there are limitations on the colors they do emit. The kind of light depends on the size of the gaps between the "shells" or energy levels in the atom. The electrons are changing "n" values in the atom. Remember "n" can have only positive whole number values like 1, 2, 3, ... up to infinity.
The kind of light energy that can be emitted by excited atoms is unique for an element. The pattern of "lines' or colors emitted can be used to identify an element. An powerful extension of this is the ability to measure amounts of an element by measuring the brightness of the emitted light.
A spectroscope can separate the light produced by an emission tube. The color seen by the naked eye is a combination of a number of colors of light. These are separated by a prism or a diffraction grating which acts like a prism. The emission lines can be seen when you look through the spectroscope at the light source. observe the "line" spectrum for the and record the spectral lines
|
|
Name __________ |
/ 10 points
Metal ion
Flame
color barium _________________________ calcium _________________________ sodium _________________________ rubidium _________________________ potassium _________________________ lithium _________________________
Part 1 Flame tests for unknown elements
Unknowns
Flame
color Identity of metal ion based on flame test Unknown 1 ____________ __________ Unknown 2 ____________ __________
|
Element |
Emission |
Emission spectrum |
|
Sodium |
||
|
Neon |
||
|
Mercury |
||
|
Helium |
Questions and observations
How do these emission spectra
compare in terms of colors and line positions? Are they
similar or do they differ?
Which of the elements Na, Ne, Hg or
He has the most visible emission lines? What is the longest wavelength in
this spectrum? Give the wavelength in nanometers.
Element with greatest
number of emission lines __________________ Longest wavelength in the
spectrum in nanometers Color of light for the
longest wavelength __________________ __________________
Which of the elements Na, Ne, Hg or
He, has the fewest number of visible emission lines?
What is the longest wavelength in
this spectrum? Give the wavelength in nanometers.
Element with fewest number
of emission lines __________________ Longest wavelength in the
spectrum in nanometers Color of light for the
longest wavelength __________________ __________________
What suggestion do you have that could improve this
experiment? What "new" idea did you learn from this experiment? Name an application for the principles illustrated in
this experiment.